Electrical sensors
This week is focused on setting up and calibrationg sensors. I decided, to work on sensor, that will be part of my final project, accelerometer. My goal was to learn how to connect, calibrate, and operate various accelerometer sensors together with the ESP32 microcontroller. As a bonus to do this week, I want to setup the accelerometer sensor as step detector, that will be used to compute running pace for my final project. I am planning to use Seeed Xiao ESP32-S3 Sense because of its small size and ability to use external sd card for data collection. Therefore, I have decided to use esp32 instead of arduino, esp32-WROOM-32D to be precise. For accelerometer sensors, I have tried two of them, MPU-6050 which is cheap small sensor and MPU-9250 that is better, but more expensive and bigger in size.
First, I have created schematic, that looks like this. Notice that external pull-up resistor haven't been used due to their inclusion in MPU-6050 sensor I2C comunication.

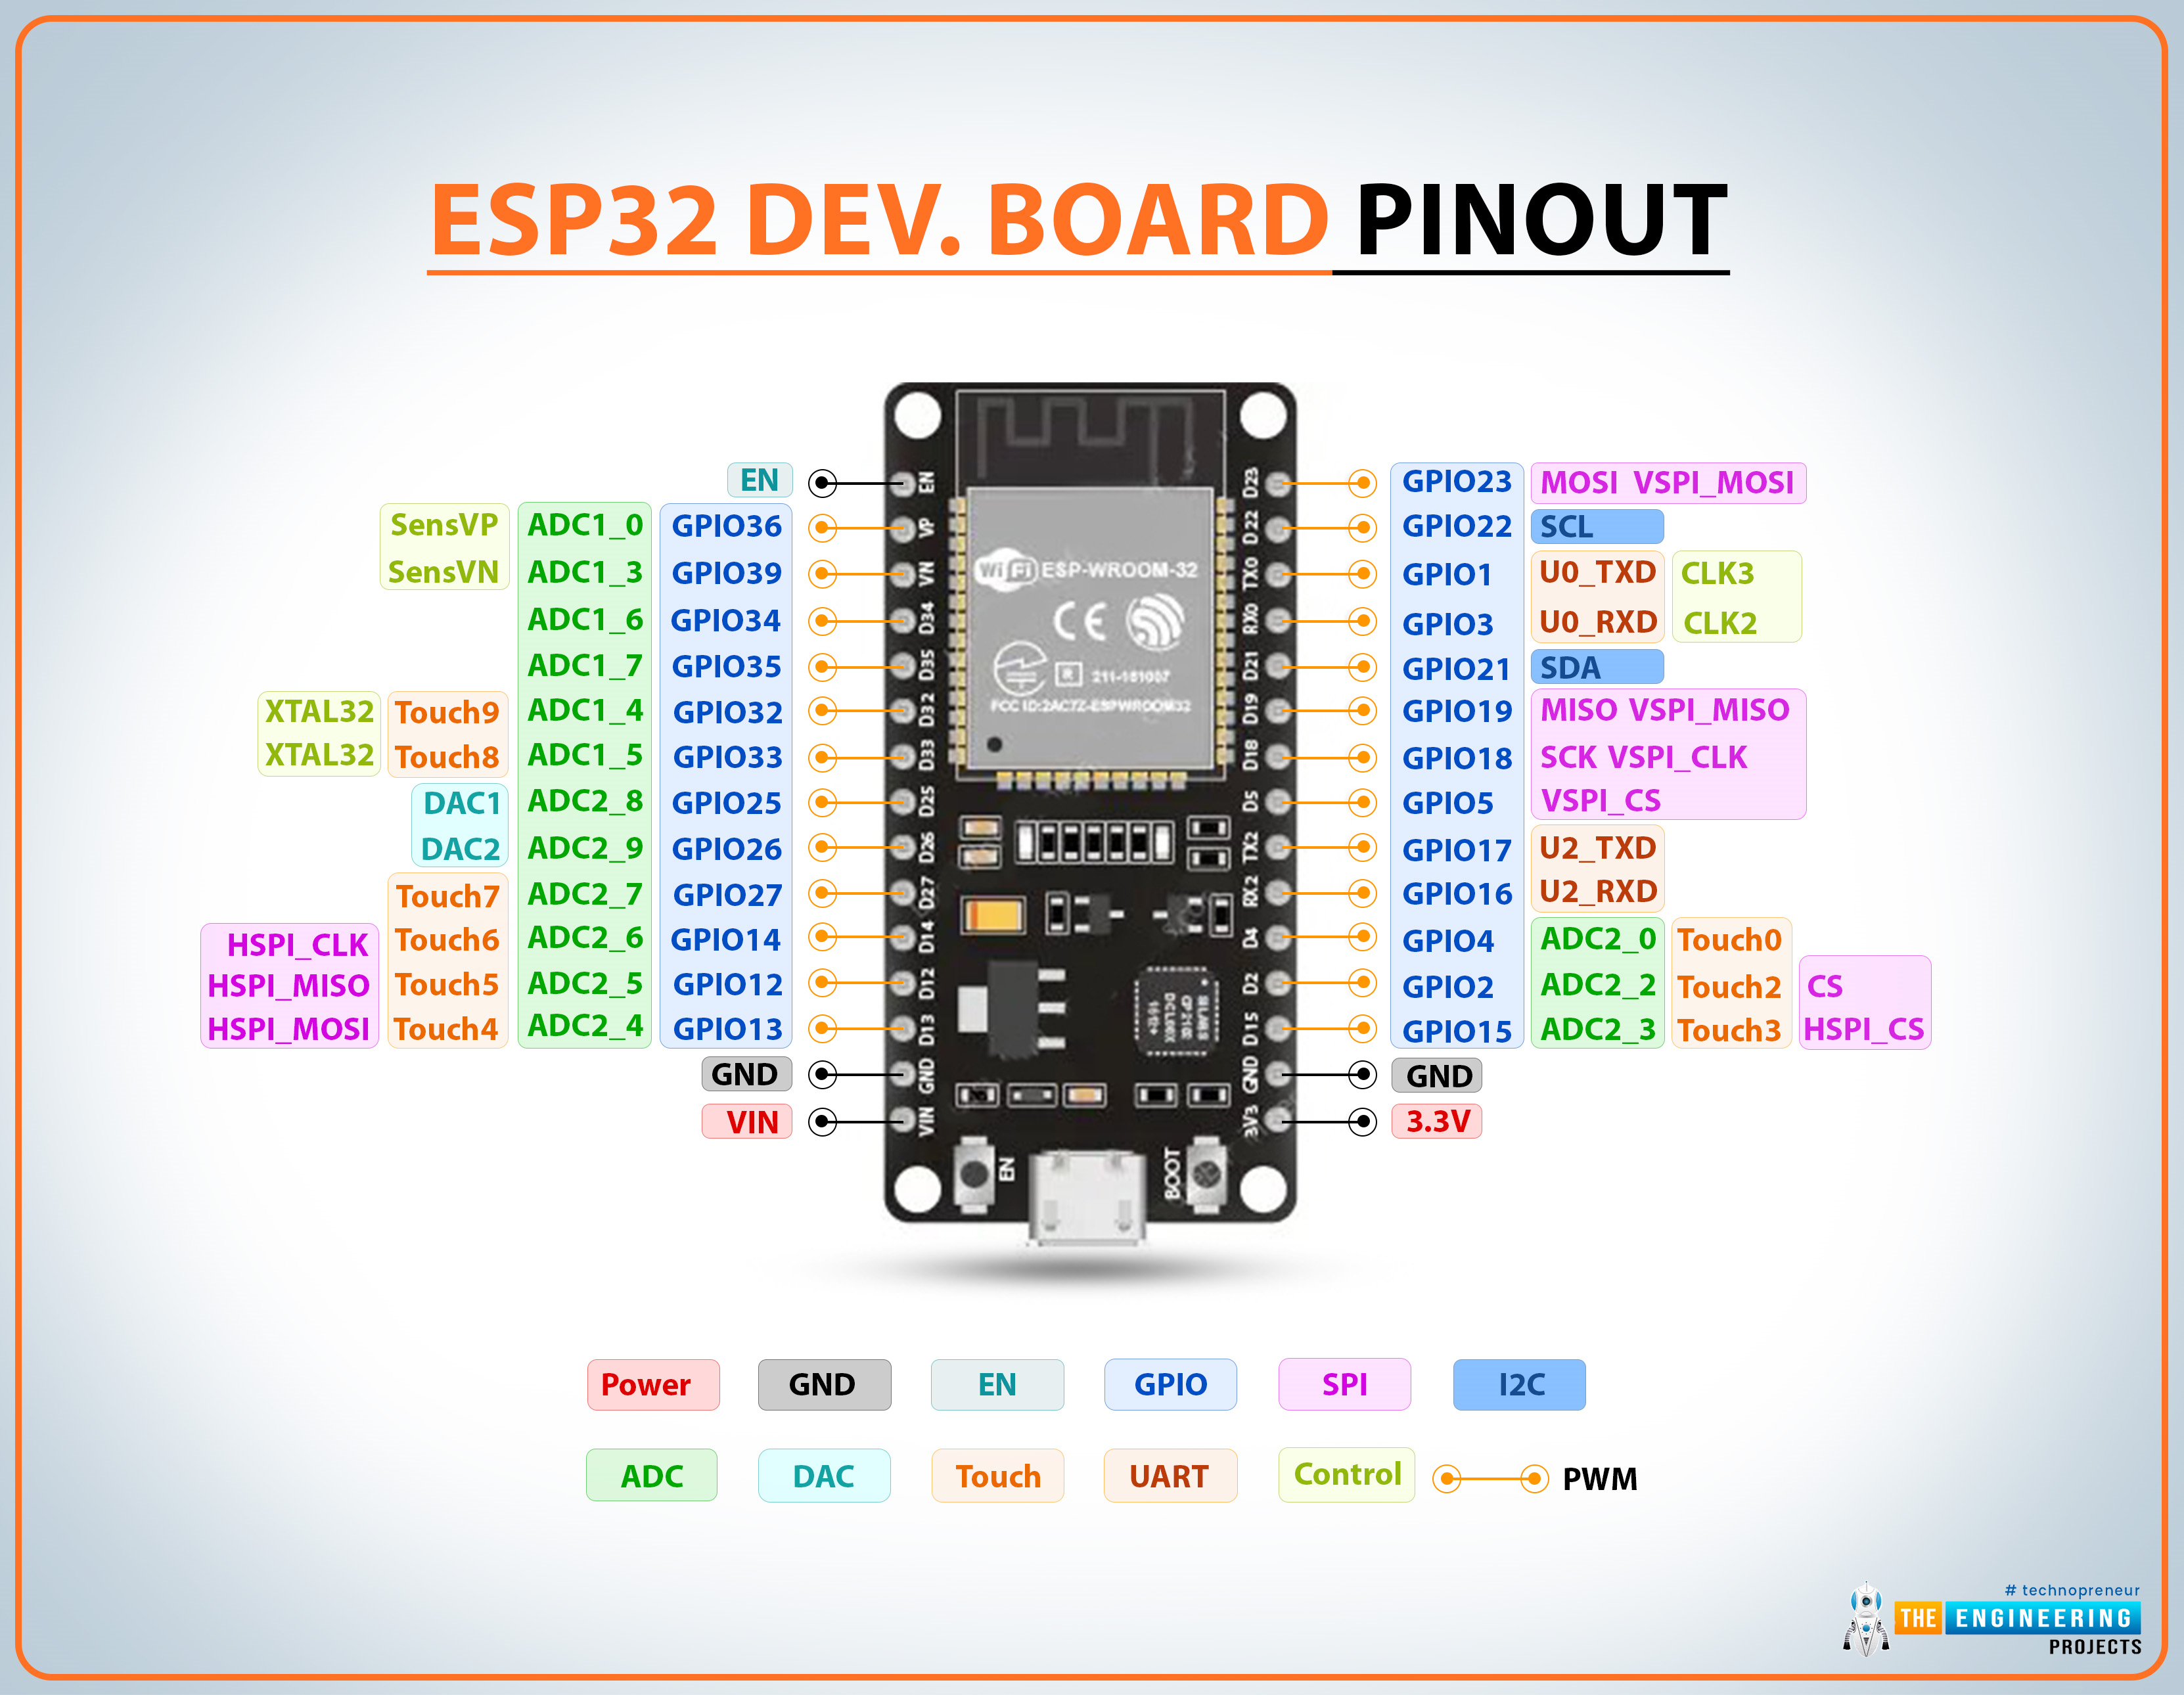
To comunicate with MPU-6050 sensor, I have used I2C protocol. As you can see in the esp32-WROOM-32D pin layout, pins that are used for I2C comunication are pin 21 for SDA and pin 22 for SCL.

Programming microcontroller
I used the PlatformIO environment in VS Code to upload the program to the ESP32. To use PlatformIO, it is needed to install PlatformIO extension inside VS Code. After that, it is needed to create project. For this project, uPesy ESP32 Wroom DevKit board and Arduino framework needs to be selected. I have used MPU-6050 library by Electronic Cats, to simplify work with the sensor. With this library, sensor calibration can be easily done with their IMU_Zero script. You can setup initial offset to compensate for errors. The script works in a way that it tries various initial offsets and checks if sensor output for acceleration and gyro returns wanted values, that means acceleration in X and Y axis near 0 and near 16384 in Z axis. 16384 is digital value corresponding to 1 G or 9,81 m/s2. To read data from serial, Serial monitor extension in VS Code is used (it is important to read at right baud rate to interpret information correctly). Calibration script returned these initial offset values:
- Acceleration X: -3107
- Acceleration Y: 1885
- Acceleration Z: 837
- Gyro X: 54
- Gyro Y: -50
- Gyro Z: 88
After that, I needed to read data from the accelerometer. For that I have used MPU6050_raw by Electronic cats which reads raw digital data and adjusted it for my use. Firstly, I have set the Baud rate to 115200 to increase number of data read from the sensor. I have also deleted printing gyro data to the terminal and transformed raw digital data to acceleration in m/s2 like data_mps2 = raw_data/16384.0*9.81. To be able to calcilate pace, I have added timestamp using millis() function. The code looks like that:
    #include "I2Cdev.h"
    #include "MPU6050.h"
    #include "U8g2lib.h"

    U8G2_SH1106_128X64_NONAME_1_HW_I2C u8g2(U8G2_R0, /* reset=*/ U8X8_PIN_NONE);

    /* MPU6050 default I2C address is 0x68*/
    MPU6050 mpu;

    /* OUTPUT FORMAT DEFINITION----------------------------------------------------------------------------------
    - Use "OUTPUT_READABLE_ACCELGYRO" if you want to see a tab-separated list of the accel
    X/Y/Z and gyro X/Y/Z values in decimal. Easy to read, but not so easy to parse, and slower over UART.

    - Use "OUTPUT_BINARY_ACCELGYRO" to send all 6 axes of data as 16-bit binary, one right after the other.
    As fast as possible without compression or data loss, easy to parse, but impossible to read for a human.
    This output format is used as an output.
    --------------------------------------------------------------------------------------------------------------*/
    #define OUTPUT_READABLE_ACCELGYRO
    //#define OUTPUT_BINARY_ACCELGYRO

    int16_t ax, ay, az;
    int16_t gx, gy, gz;
    bool blinkState;
    int16_t ax_offset = -3107;
    int16_t ay_offset = 1885;
    int16_t az_offset = 837;
    int16_t gx_offset = 54;
    int16_t gy_offset = -50;
    int16_t gz_offset = 88;

    void setup() {
        /*--Start I2C interface--*/
        #if I2CDEV_IMPLEMENTATION == I2CDEV_ARDUINO_WIRE
        Wire.begin();
        #elif I2CDEV_IMPLEMENTATION == I2CDEV_BUILTIN_FASTWIRE
        Fastwire::setup(400, true);
        #endif

        Serial.begin(115200); //Initializate Serial wo work well at 8MHz/16MHz

        /*Initialize device and check connection*/
        Serial.println("Initializing MPU...");
        mpu.initialize();
        Serial.println("Testing MPU6050 connection...");
        if(mpu.testConnection() ==  false){
        Serial.println("MPU6050 connection failed");
        while(true);
        }
        else{
        Serial.println("MPU6050 connection successful");
        }
        mpu.setDLPFMode(4);

        u8g2.begin();
        while (!Serial) {
        delay(10); // will pause Zero, Leonardo, etc until serial console opens
        }

        /* Use the code below to change accel/gyro offset values. Use MPU6050_Zero to obtain the recommended offsets */
        Serial.println("Updating internal sensor offsets...\n");
        mpu.setXAccelOffset(ax_offset); //Set your accelerometer offset for axis X
        mpu.setYAccelOffset(ay_offset); //Set your accelerometer offset for axis Y
        mpu.setZAccelOffset(az_offset); //Set your accelerometer offset for axis Z
        mpu.setXGyroOffset(gx_offset);  //Set your gyro offset for axis X
        mpu.setYGyroOffset(gy_offset);  //Set your gyro offset for axis Y
        mpu.setZGyroOffset(gz_offset);  //Set your gyro offset for axis Z
        /*Print the defined offsets*/
        Serial.print("\t");
        Serial.print(mpu.getXAccelOffset());
        Serial.print("\t");
        Serial.print(mpu.getYAccelOffset());
        Serial.print("\t");
        Serial.print(mpu.getZAccelOffset());
        Serial.print("\t");
        Serial.print(mpu.getXGyroOffset());
        Serial.print("\t");
        Serial.print(mpu.getYGyroOffset());
        Serial.print("\t");
        Serial.print(mpu.getZGyroOffset());
        Serial.print("\n");

        /*Configure board LED pin for output*/
        pinMode(LED_BUILTIN, OUTPUT);
    }

    void loop() {
        unsigned long currentMillis = millis();
        /* Read raw accel/gyro data from the module. Other methods commented*/
        mpu.getMotion6(&ax, &ay, &az, &gx, &gy, &gz);
        //mpu.getAcceleration(&ax, &ay, &az);
        //mpu.getRotation(&gx, &gy, &gz);

        /*Print the obtained data on the defined format*/
        #ifdef OUTPUT_READABLE_ACCELGYRO
        float ax_mps2 = ax/16384.0*9.81;
        float ay_mps2 = ay/16384.0*9.81;
        float az_mps2 = az/16384.0*9.81;

        Serial.print(currentMillis/1000.0); Serial.print("\t");
        Serial.print(ax_mps2); Serial.print("\t");
        Serial.print(ay_mps2); Serial.print("\t");
        Serial.println(az_mps2);
        #endif

        #ifdef OUTPUT_BINARY_ACCELGYRO
        Serial.write((uint8_t)(ax >> 8)); Serial.write((uint8_t)(ax & 0xFF));
        Serial.write((uint8_t)(ay >> 8)); Serial.write((uint8_t)(ay & 0xFF));
        Serial.write((uint8_t)(az >> 8)); Serial.write((uint8_t)(az & 0xFF));
        Serial.write((uint8_t)(gx >> 8)); Serial.write((uint8_t)(gx & 0xFF));
        Serial.write((uint8_t)(gy >> 8)); Serial.write((uint8_t)(gy & 0xFF));
        Serial.write((uint8_t)(gz >> 8)); Serial.write((uint8_t)(gz & 0xFF));
        #endif

        u8g2.setFont(u8g2_font_ncenB14_tr);
        u8g2.firstPage();
        do {
        u8g2.setCursor(0, 20);
        u8g2.print(ax_mps2);
        u8g2.setCursor(45, 20);
        u8g2.print(ay_mps2);
        u8g2.setCursor(90, 20);
        u8g2.print(az_mps2);
        } while ( u8g2.nextPage() );

        /*Blink LED to indicate activity*/
        blinkState = !blinkState;
        digitalWrite(LED_BUILTIN, blinkState);
    }
This code is adjusted for writing out acceleration in all three axis on OLED display using U8g2lib library. I am planning to use OLED display in my final project, so I have also tried to work with it. It is possible to use code without the U8g2lib sections to use sensor only.
After that, I tried to read data from serial port and detect steps using data from the sensor. I have used python to do that and with help of ChatGPT created script that reads from serial port and save data in format: "seconds acceleration_x acceleration_y acceleration_z" to .csv file. The python script looks like this:
    import serial
    import csv
    import time

    # Set the correct port (change this based on `ls /dev/tty.*` output)
    SERIAL_PORT = "/dev/tty.usbserial-10"  # This line might be different for you
    BAUD_RATE = 115200
    OUTPUT_FILE = "output.csv"

    try:
        # Open serial connection
        ser = serial.Serial(SERIAL_PORT, BAUD_RATE, timeout=0)
        time.sleep(2)  # Allow time for connection

        # Open CSV file
        with open(OUTPUT_FILE, mode='w', newline='') as file:
            writer = csv.writer(file)
            writer.writerow(["Time", "Accel_X", "Accel_Y", "Accel_Z"])  # Header

            print("Reading from serial and saving to CSV... Press Ctrl+C to stop.")

            while True:
                line = ser.readline().decode('utf-8').strip()  # Read and decode
                if line:
                    data = line.split(",")  # Split data (comma-separated)
                    writer.writerow(data)
                    print(data)

    except serial.SerialException as e:
        print(f"Error: {e}")

    except KeyboardInterrupt:
        print("\nStopped by user.")

    finally:
        if 'ser' in locals() and ser.is_open:
            ser.close()
        print("Serial port closed.")
To interpret the data as steps, acceleration in all three axis is then set as 3D vector in each timestamp and it's norm is then calculated as acc_norm = √ (acc_x2 + acc_y2 + acc_z2). Mean of the data is then subtracted from the data to plot only acceleration differences in time stamps. Because of the quality of the sensor, the output is quite noisy. To reduce the noise, I have tried to apply moving average on the signal and applying low pass filter implemented inside the MPU-6050 sensor using the MPU-6050 library. The low pass filter with bandwidth of 20 Hz worked quite well so far, so it is probably going to be the option I will be using in the future.
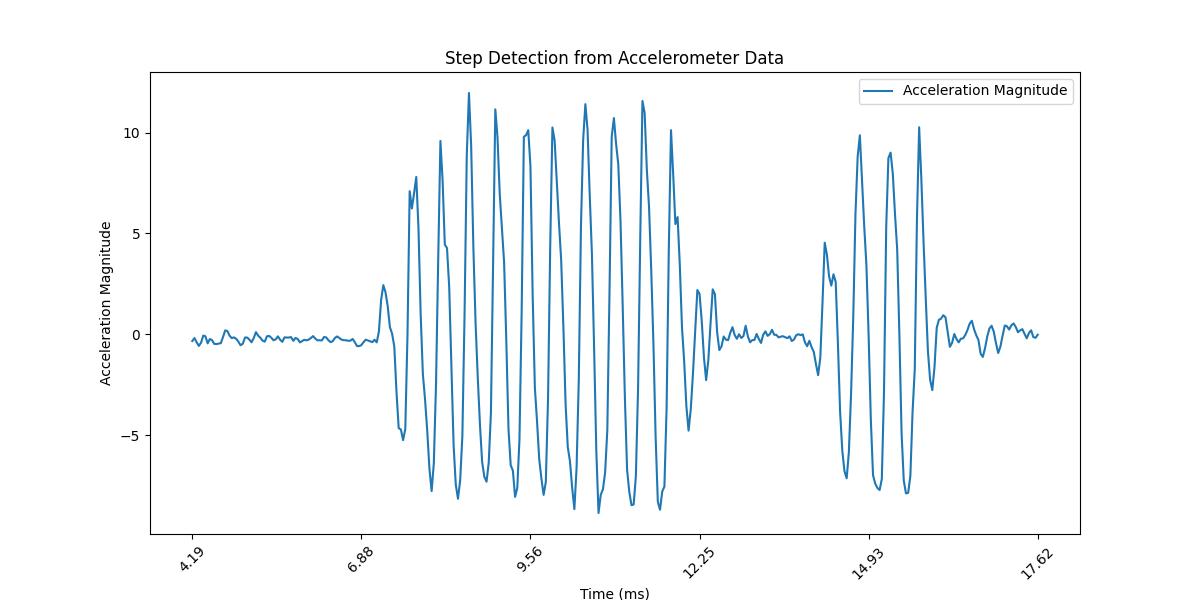

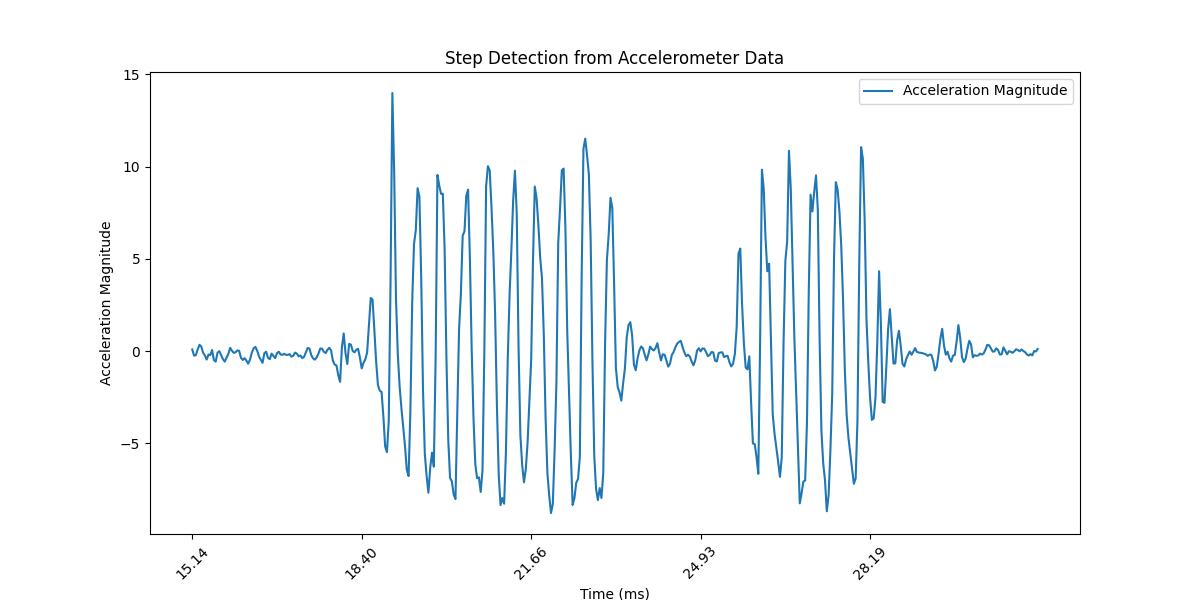
And here is the code used for plot.
    import pandas as pd
    import numpy as np
    import matplotlib.pyplot as plt

    csv_file = "output.csv"

    def moving_average_pandas(data, window_size):
        series = pd.Series(data)
        return series.rolling(window=window_size).mean()

    data = []
    with open(csv_file, "r") as file:
        for line in file:
            parts = line.strip().split("\t")  # Split by tab
            print(parts)
            if len(parts) < 3:  # Skip invalid lines
                continue

            # Extract timestamp and acceleration values
            timestamp = parts[0]
            ax = parts[1]
            ay = parts[2]
            az = parts[3]
            a_magnitude = np.sqrt(float(ax)**2 + float(ay)**2 + float(az)**2)

            data.append([timestamp, ax, ay, az, a_magnitude])

    # # Convert to DataFrame
    df = pd.DataFrame(data, columns=["Timestamp", "Ax", "Ay", "Az", "AMagnitude"])
    df["AMagnitude"] = df["AMagnitude"]-df["AMagnitude"].mean()
    df["moving_avg"] = moving_average_pandas(df["AMagnitude"], window_size=10)

    # Plot the signal and detected steps
    plt.figure(figsize=(12, 6))
    plt.plot(df["Timestamp"], df["AMagnitude"], label="Acceleration Magnitude")
    tick_positions = df["Timestamp"].iloc[::len(df)//5]
    plt.xticks(tick_positions, rotation=45)

    plt.xlabel("Time (ms)")
    plt.ylabel("Acceleration Magnitude")
    plt.title("Step Detection from Accelerometer Data")
    plt.legend()
    plt.show()